If you do not see the graph, make the application window larger.
To log data from the profiler, see Logging data from a profiler.
When you press the P key, if the threshold you set is exceeded, Kanzi logs a notification:
The Kanzi performance profiling system enables you to measure the performance of your Kanzi application.
Here you can find out how to measure the performance of your code in your Kanzi application. To measure the performance of different parts of Kanzi Engine during application startup and the tasks that Kanzi runs in the main loop, use the performance profilers in the Profiling build. See Measuring the performance of Kanzi Engine.
To measure the performance of your application code you can:
To group the performance measurements of functions and scopes, create your own performance profiling categories.
To create a performance profiling category, use the kzProfilingCreateCategory macro to define the category and the kzProfilingRegisterCategory macro to register the category.
For example:
// Define a performance profiling category MY_PROFILING_CATEGORY.
// Set the compile-time state of the category to enabled, name the category MyProfilingCategory,
// and set the sample buffer size of the category to 200.
#define MY_PROFILING_CATEGORY kzProfilingCreateCategory(KZ_PROFILING_ENABLED_CATEGORY, "MyProfilingCategory", 200)
// Register the performance profiling category MY_PROFILING_CATEGORY and set its initial runtime state to enabled.
// The runtime state of a performance profiling category controls whether profilers in the category collect samples.
// You can control the runtime state of performance profiling categories in the application configuration.
// See ProfilingCategoryFilter.
kzProfilingRegisterCategory(MY_PROFILING_CATEGORY, KZ_PROFILING_ENABLED_CATEGORY)
You can use the performance profiling category you created to profile the performance of:
You can use Kanzi profiling macros to measure the execution time of any scope in your application code:
kzProfileScope profiles the execution time of a scope.kzProfileScopeExtended profiles the execution time of a scope using a custom profiler registry and sample buffer size.To measure the performance of a scope:
KZ_PROFILING_CATEGORY_GENERIC.kzProfileScope macro.kzProfileScope macro creates a profiler and registers the profiler in the Default Profiler Registry. Every time the scope is entered, Kanzi adds to the profiler a new sample which includes the time spent executing this scope.if (!m_interpolationActive) block in the Scroll view example: // Activate interpolation playback by adding it to the code.
if (!m_interpolationActive)
{
// kzProfileScope() measures the time it takes to execute this scope.
// The profiler created by kzProfileScope() is assigned to the KZ_PROFILING_CATEGORY_GENERIC category and registered in the Default Profiler Registry.
// The name of the profiler is "Activate interpolation playback".
// Every time this scope is entered, that is when "!m_interpolationActive" is true, Kanzi adds a new sample to the profiler.
kzProfileScope(KZ_PROFILING_CATEGORY_GENERIC, "Activate interpolation playback");
getDomain()->getRootTimelineClock()->addTimelinePlayback(m_interpolationPlayback);
m_interpolationActive = true;
}Kanzi writes the performance measurement information to the log.
info:profiling> Generic::Activate interpolation playback:
info:profiling>   Total duration [ns]: 34279
info:profiling>   Number of intervals: 1
info:profiling>   Average duration [ns]: 34279
info:profiling>   Longest duration [ns]: 34279
info:profiling>   Shortest duration [ns]: 34279
You can use the kzProfileFunction macro to measure the execution time of functions in your application code.
To measure the performance of a function:
KZ_PROFILING_CATEGORY_GENERIC.kzProfileFunction macro.kzProfileFunction macro creates in this function a static profiler and registers the profiler in the Default Profiler Registry. Every time the function is called, Kanzi adds to the profiler a new sample which includes the time spent executing this function.onScrollViewScrolled() function in the Scroll view example: void onScrollViewScrolled(ScrollView3D::ScrollMessageArguments& messageArguments)
{
// kzProfileFunction() measures the time it takes to execute the onScrollViewScrolled() function.
// The profiler created by kzProfileFunction() is assigned to the KZ_PROFILING_CATEGORY_GENERIC category and registered in the Default Profiler Registry.
// The name of the profiler is provided by the compiler and includes the name of this function. See KZ_PROFILING_THIS_FUNCTION_NAME.
// Every time the onScrollViewScrolled() function is called, Kanzi adds a new sample to the profiler.
kzProfileFunction(KZ_PROFILING_CATEGORY_GENERIC);
...
}Kanzi writes the performance measurement information to the log.
In the log Number of intervals shows how many times the function was called.
info:profiling> Generic::void __thiscall ScrollViewApplication::onScrollViewScrolled(class kanzi::ScrollViewConcept::ScrollMessageArguments &):
info:profiling>   Total duration [ns]: 200211
info:profiling>   Number of intervals: 246
info:profiling>   Average duration [ns]: 813
info:profiling>   Longest duration [ns]: 16410
info:profiling>   Shortest duration [ns]: 364
To measure the performance of custom main loop tasks:
KZ_PROFILING_CATEGORY_GENERIC.MainLoopTaskProfilerSharedPtr m_onScrollViewScrolledProfiler;
onScrollViewScrolled() function in the Scroll view example, in the scroll_view.cpp file in the onProjectLoaded() function add:// Create a main loop task profiler in theKZ_PROFILING_CATEGORY_GENERICcategory. // Set the title of the performance graph in the Performance HUD to "Main loop: Scroll View scrolled". // Set the sample buffer size of the profiler to be the same as the sample buffer size ofKZ_PROFILING_CATEGORY_GENERIC. m_onScrollViewScrolledProfiler = MainLoopTaskProfiler::create("Main loop: Scroll View scrolled", kzProfilingGetCategoryRuntimeReference(KZ_PROFILING_CATEGORY_GENERIC), kzProfilingGetCategorySampleBufferSize(KZ_PROFILING_CATEGORY_GENERIC)); // Register the profiler to the main loop task registry. // The Performance HUD goes through all profilers registered in theMainLoopTaskProfilerRegistry// and draws the performance graphs for those profilers whose profiling category state is set to "shown in HUD". // To access the state of a profiling category use theProfilingCategory::isShownInHUD()function. getDomain()->getMainLoopTaskProfilerRegistry().registerProfiler(m_onScrollViewScrolledProfiler);
kzProfileScopeWithSamplerExtended macro to profile the execution time of the onScrollViewScrolled() function using a sampler.kzProfileScopeWithSamplerExtended macro the profiler that you created in the previous step. This way you can create the profiler outside of the scope that you want to profile. void onScrollViewScrolled(ScrollView3D::ScrollMessageArguments& messageArguments)
{
// Pass to the kzProfileScopeWithSamplerExtended macro the m_onScrollViewScrolledProfiler profiler that you created.
// The MainLoopTaskProfilingSampler collects interval measurement data.
// The MainLoopTaskProfilerRegistry::getMainLoopCounter() function gets the value of the main loop counter.
kzProfileScopeWithSamplerExtended(KZ_PROFILING_CATEGORY_GENERIC,
m_onScrollViewScrolledProfiler,
MainLoopTaskProfilingSampler,
(getDomain()->getMainLoopTaskProfilerRegistry().getMainLoopCounter()));
...
} // Handle the keyboard input for the application.
virtual void onKeyInputEvent(const KzsInputEventKey* inputData) KZ_OVERRIDE
{
KzsInputKey button = kzsInputEventKeyGetButton(inputData);
KzsInputKeyDeviceState state = kzsInputEventKeyGetState(inputData);
if (state == KZS_KEY_DEVICE_STATE_DOWN)
{
switch (button)
{
case KZS_KEY_P:
// Define the duration threshold.
chrono::nanoseconds threshold(1000);
// Log sample data.
m_onScrollViewScrolledProfiler->logAllData();
// Check whether the threshold was exceeded.
if (m_onScrollViewScrolledProfiler->getProfilingStatistics().m_longestInterval > threshold)
{
// Find on which iterations the threshold was exceeded.
for (size_t i = 0; i < m_onScrollViewScrolledProfiler->getSampleCount(); ++i)
{
const MainLoopTaskProfilerSampleData& s = m_onScrollViewScrolledProfiler->getSample(i);
if (s.m_duration > threshold)
{
kzLogDebug(("The threshold was exceeded on main loop iteration {} - the duration was {} ns.", s.m_mainLoopCounter, static_cast<uint64_t>(s.m_duration.count())));
}
}
}
...
}
}
}
# Enable the display of the full Performance HUD.
PerformanceInfoLevel = 2
# Show performance profiling graphs for the performance profilers which belong to the KZ_PROFILING_CATEGORY_GENERIC category.
ProfilingCategoryFilter="Generic=show"
performance_info.hpp header file.#include <kanzi/core.ui/application/performance_info.hpp>
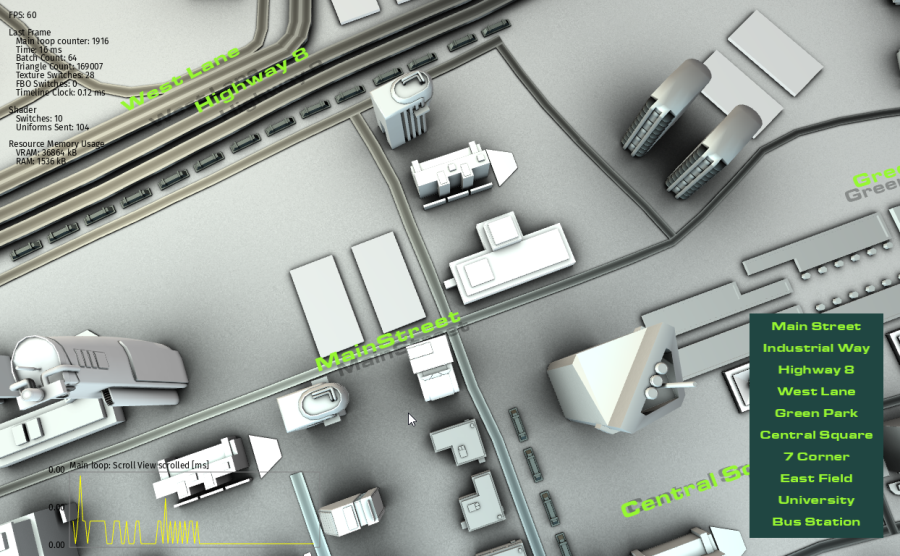
onProjectLoaded function add:// Get the performanceInfo object. If the object does not exist, create it. PerformanceInfo& performanceInfo = acquirePerformanceInfo(); // Set the color of graph frames to gray. performanceInfo.setBorderColor(ColorRGBA(0.5f, 0.5f, 0.5f)); // Set the color of graph data to yellow. performanceInfo.setLineColor(ColorRGBA(1.0f, 1.0f, 0.0f)); // Set the color of text to black. performanceInfo.setFontColor(ColorRGBA(0.0f, 0.0f, 0.0f));
When you run the application, the Performance HUD shows in the bottom left corner of the application screen the performance profiling graph for the performance profiler you created.
If you do not see the graph, make the application window larger.
To log data from the profiler, see Logging data from a profiler.
When you press the P key, if the threshold you set is exceeded, Kanzi logs a notification:
info:debug> The threshold was exceeded on main loop iteration 2 - the duration was 4376 ns.
To analyze the performance of your application code, log the performance profiling data. You can log per-sample and summary data from the profilers that you create and from profiler registries.
You can log data from the profilers that you create. See Measuring the performance of custom main loop tasks.
To log data from a profiler:
logAllData() function.m_onScrollViewScrolledProfiler profiler, usegetDomain()->getMainLoopTaskProfilerRegistry().m_onScrollViewScrolledProfiler->logAllData();
To log a summary of data from a profiler, use the logAggregateData() function.
For example, to log a summary of data from the m_onScrollViewScrolledProfiler profiler, use
getDomain()->getMainLoopTaskProfilerRegistry().m_onScrollViewScrolledProfiler->logAggregateData();
You can log data from all profilers registered in a specific profiler registry by iterating through the profilers and calling the logAggregateData() or logAllData() function.
For example, to log a summary of performance profiling data from all profilers, including function and scope profilers, registered in the Default Profiler Registry when exiting the application:
    // Kanzi calls this function when the application exits.
    virtual void onShutdown() KZ_OVERRIDE
    {
        // Get the Default Profiler Registry DefaultProfilerRegistry where the profiling system registers function and scope profilers.
        AbstractProfilerRegistry& registry = kzProfilingGetDefaultRegistry();

        // Go through all profilers in the Default Profiler Registry and log a summary of their data.
        for (AbstractProfilerRegistry::ProfilerContainer::const_iterator
            profilerIter = registry.beginProfilers(),
            profilerIterEnd = registry.endProfilers();
            profilerIter != profilerIterEnd; ++profilerIter)
        {
            (*profilerIter)->logAggregateData();
        }
    }
Measuring application performance
Measuring the performance of Kanzi Engine
